Logs and metrics
Follow builds, read app logs, open a shell in a container and chart CPU, memory and network use.
Helipod gives you four places to see what a service is doing: the Deployments tab for builds and deploys, the Metrics and Terminal tabs of each service, the project-wide Logs page, and Observability dashboards that you arrange yourself.
Deployments tab
Open a service on the Containers page. The Deployments tab shows the current deployment at the top and older ones below it.
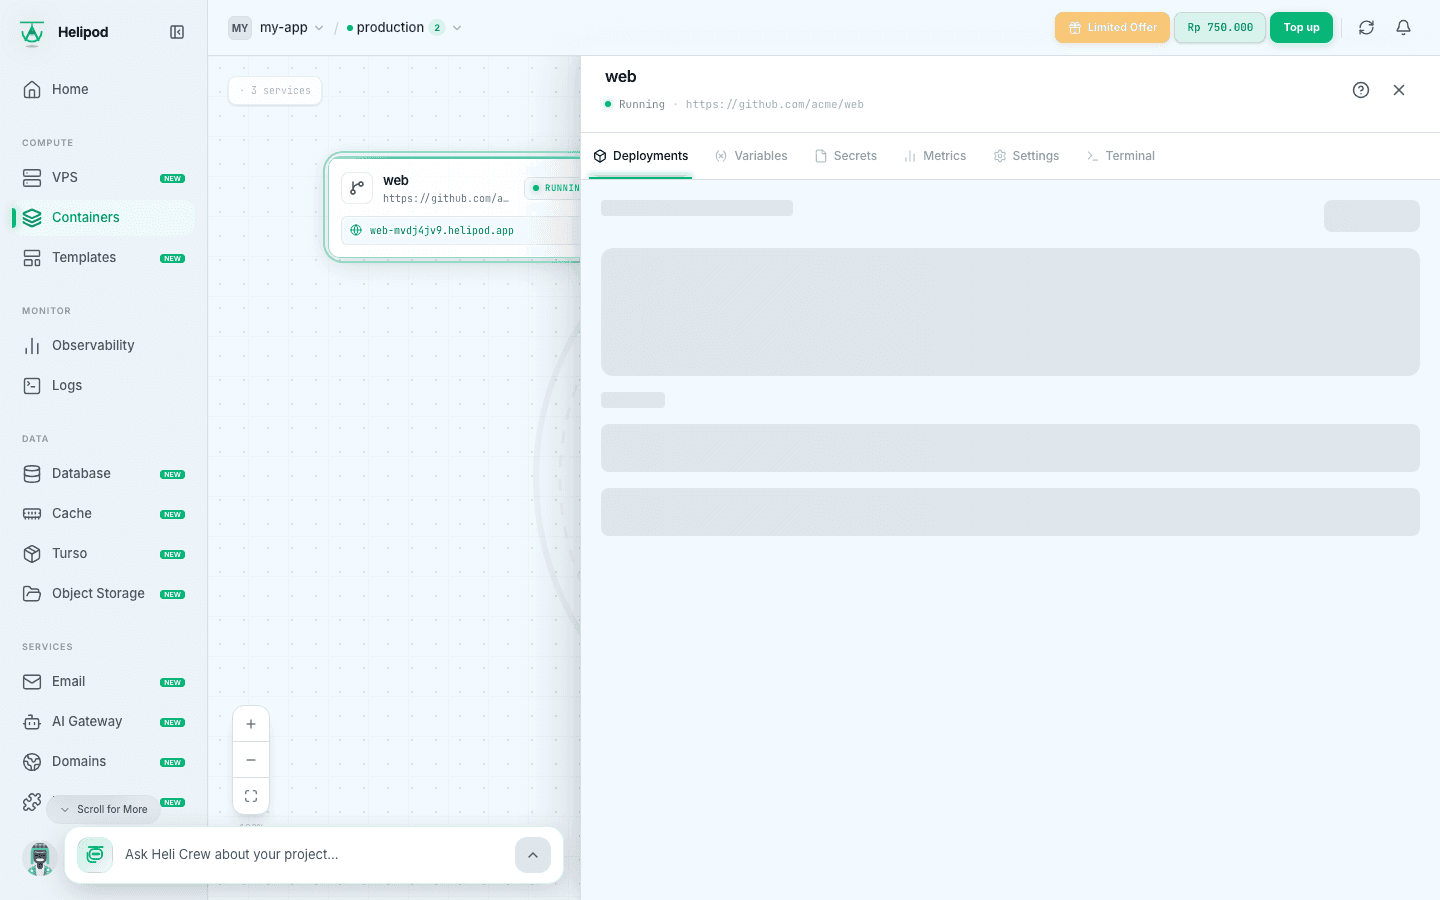
| Status | Meaning |
|---|---|
| Queued | Waiting to start |
| Deploying | Building or rolling out |
| Live | Serving live traffic |
| Failed | The build or start failed; check the logs |
| Removed / Cancelled | No longer running, or stopped before it finished |
From here you can:
- Deploy (or Redeploy when a version is live): starts a new build and replaces the live deployment when it is ready.
- Restart: restarts the running containers without a new build. Expect about 10 to 30 seconds of downtime; with several replicas they restart one after another.
- Build logs (or Live logs while it runs): the build and deploy output of that deployment. Older deployments have a Logs button too, and Delete to remove the record (the running service is not affected).
- App logs: what your app prints to stdout and stderr. Type in Filter… to search, and pick a range from 5 minutes to the last day, or follow it live.
In both log views, click Follow to jump to the newest line and keep scrolling with new output.
Metrics tab
Metrics shows the service's current CPU (in millicores), Memory (with the share of its limit), Restarts and Uptime, and charts for CPU Usage, Memory Usage and Network I/O (in and out, in KB/s). Pick a range from 5 min to 1 day.
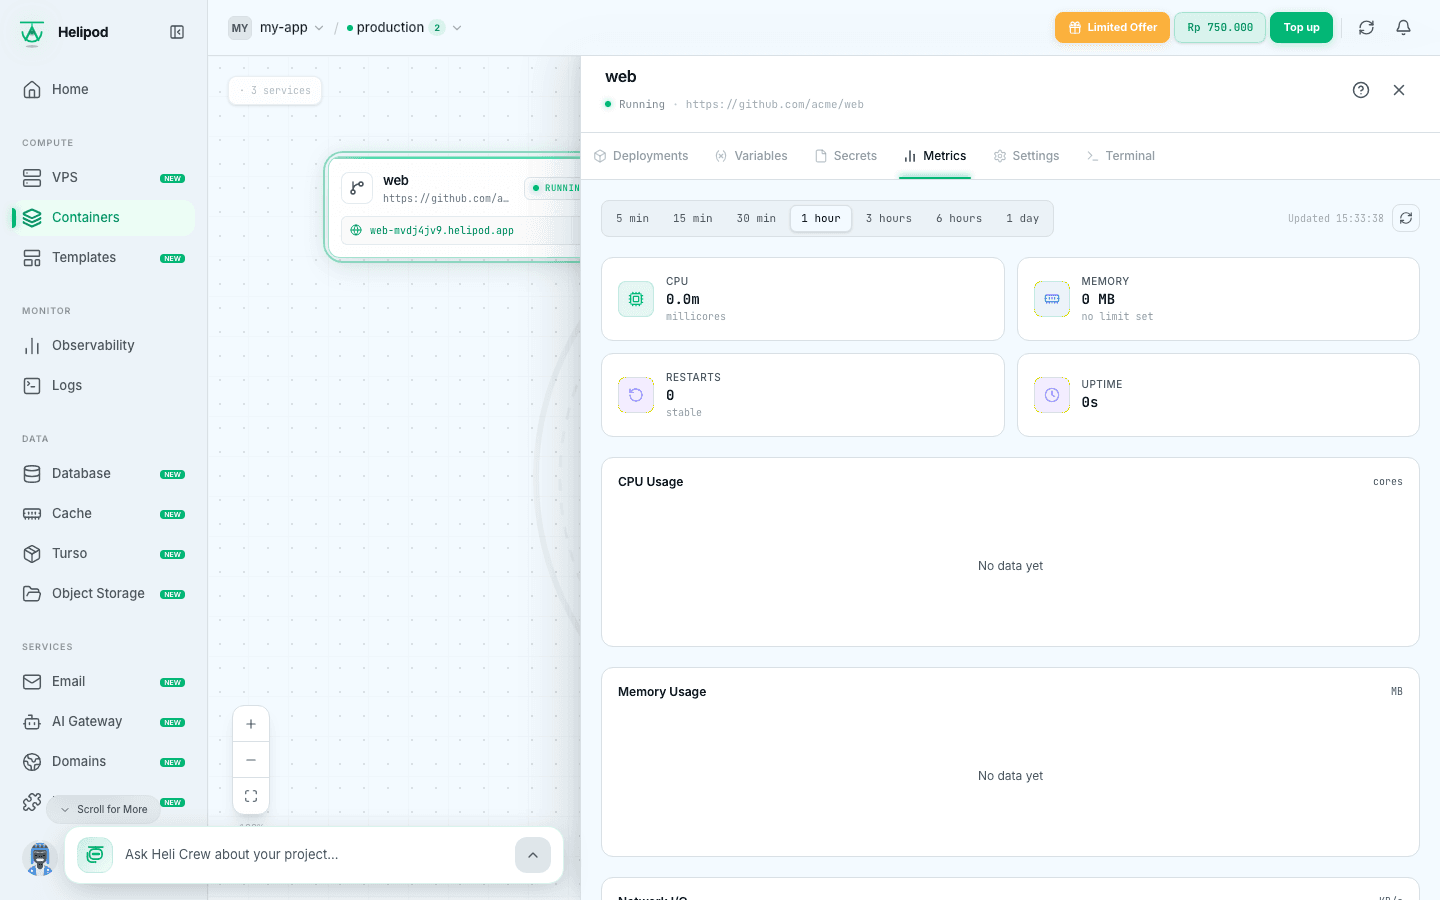
Memory close to the limit or a growing restart count usually means the service needs more memory, see Volumes and scaling.
Terminal tab
Terminal opens a shell inside the running container. Click Connect, then run commands as you would over SSH, for example to check a file or run a migration:
ls /app
node scripts/migrate.js
Use Reconnect if the session drops. Changes you make to files outside a volume are lost on the next deploy.
The Logs page
Click Logs in the sidebar to read the logs of every service in the environment in one place.
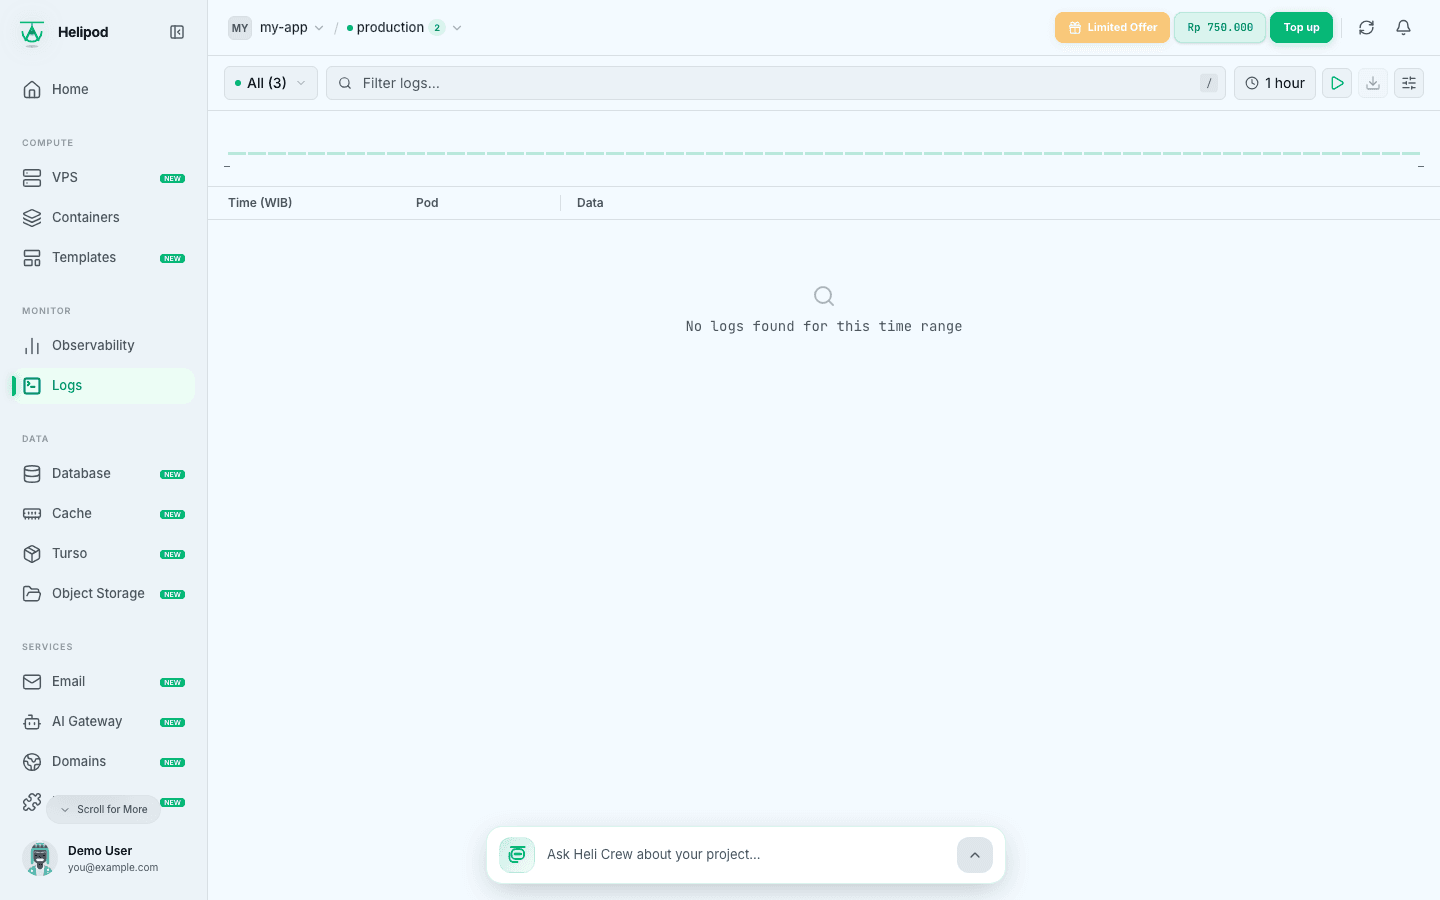
- Pod picker: show All pods or choose one service.
- Time range: from 5 min to 30 day, or Live tail to stream new lines.
- Filter logs…: search the loaded lines.
- Display and Columns: choose what each line shows (time in WIB, pod, deploy, replica, data).
Click a line to see all of its fields.
Observability
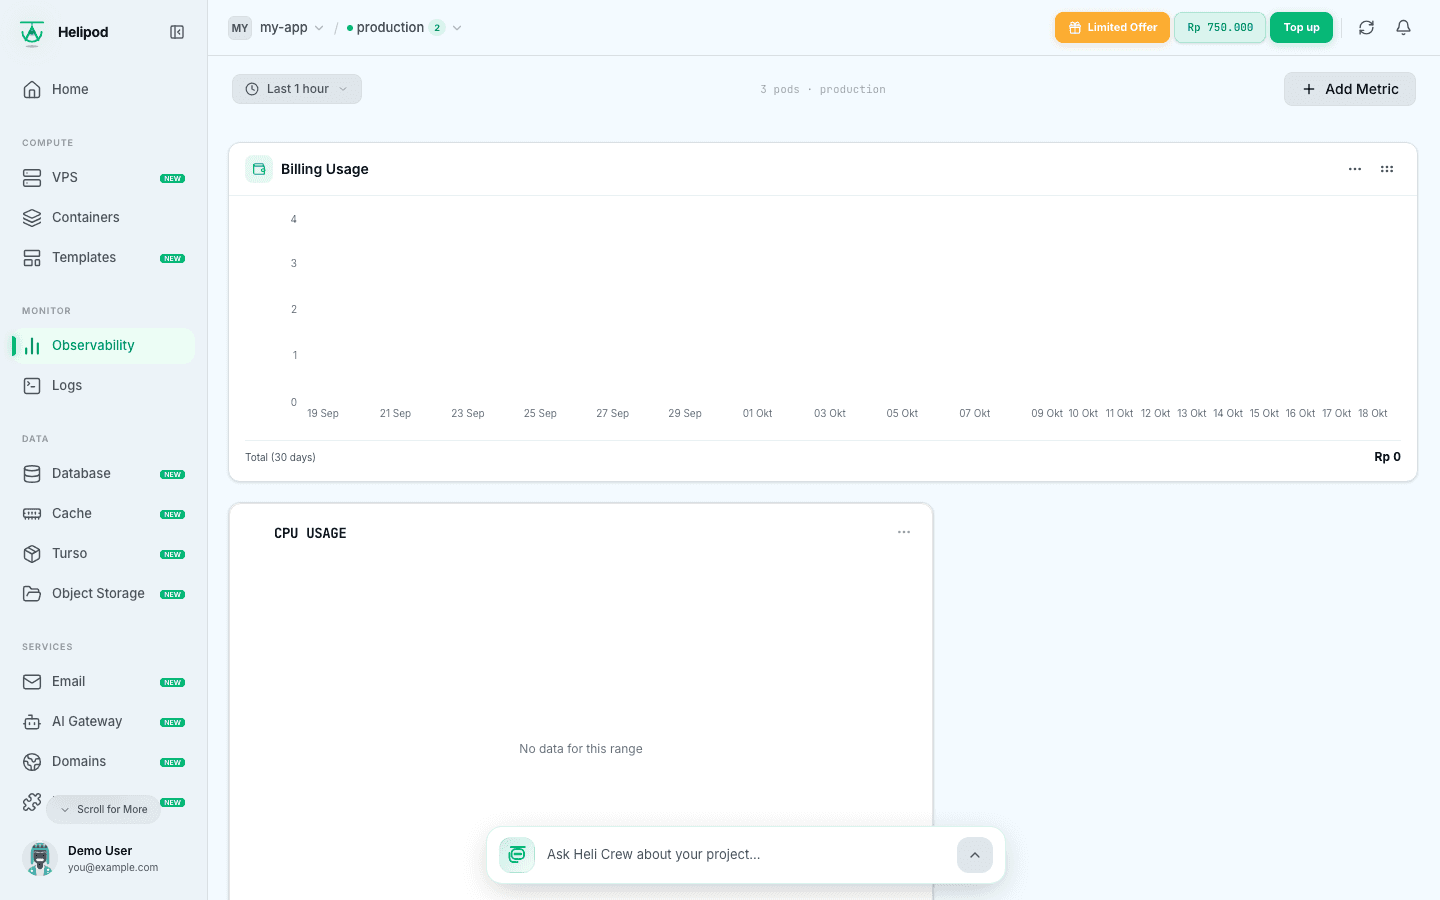
Observability in the sidebar is a dashboard you build from metric blocks. It always starts with Billing Usage, your spending over time.
Add a metric block
Click Add Metric and choose a Metric: CPU Usage, Memory Usage, Network In or Network Out.
Choose the pods
Select one or more services of the environment, and optionally give the block a Chart Title (Optional). Click Add to Dashboard.
Arrange the dashboard
Drag a block by its handle to move it and drag its corner to resize it. Pick a time range from 5 min to 1 day for all blocks. The layout is saved automatically (you see Saved), per environment. Use a block's menu to remove it.
Metrics need a running service
Charts fill in only while a service is Live. A new service shows no data until its first deploy succeeds.